 http://commons.wikimedia.org/wiki/Image:UK_abortion_by_gestational_age_2004_histogram.svg
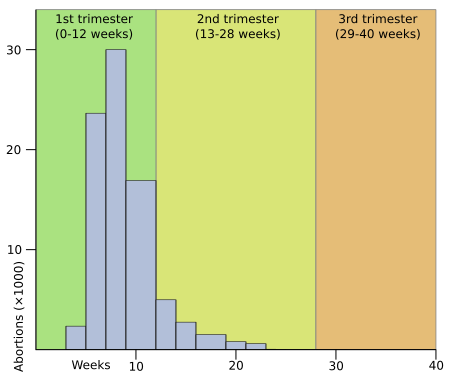
This histogram map is one that shows that maps can be more than just topographical maps of Canada or books about unknown places like the jungles of Brazil. Maps are able to bring people information, sometimes very important, but also very controversial. The above graph shows the statistics for abortions in the U.K. after varying numbers of weeks. Although this data might seem unimportant, or even not wanted, maps really help to visualize to people what raw data says. Here, it is much easier to get the sense of how early on women chose to do this treatment, and although it might be offensive for some women to understand, this map is able to put things into perspective for all parties involved.
No comments:
Post a Comment